Developer Tools
- Lively for Qt comes with a number of developer tools that are
intended for interactive software development:
- You can open any number of these tools simultaneously.
- NOTE: The application storage features of Lively for Qt
are not available yet. Unless you use Qt's
File or
Network APIs,
you cannot save the changes that
you have made using the interactive tools summarized here.
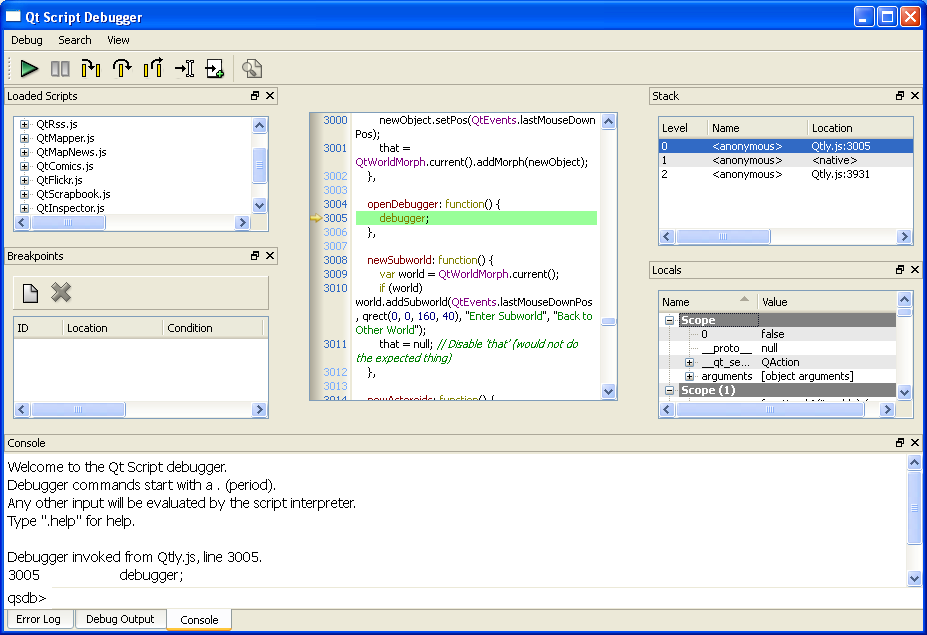
Debugger
- Lively for Qt includes an interactive source-level debugger that is part of the JavaScript support provided by Qt.
- The debugger supports features such as:
- Single-stepping
- Breakpoints
- Call stack & local variable visualization
- Command-line debugging
- To open a debugger window, choose the Tools->Debugger menu item from
the world's popup menu.
- A debugger window is opened automatically if an error occurs during the
execution of the JavaScript application or the Lively for Qt system itself.
- Read the
QtScriptDebugger Manual for further information.
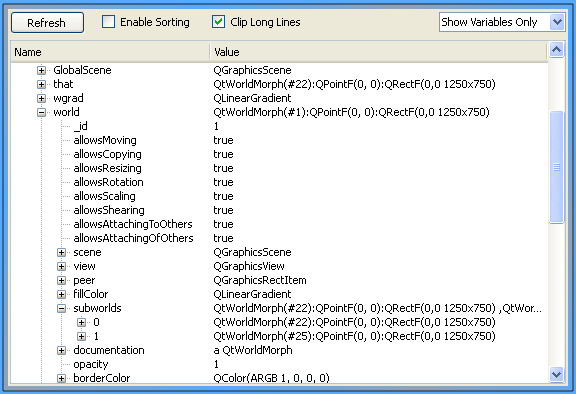
Object Inspector
- Lively for Qt includes an object inspector that can be used for viewing
the entire object hierarchy (global namespace of the JavaScript engine), or the
internals of individual JavaScript objects.
- To open an inspector to view the entire object hierarchy,
choose the Tools->Inspector menu item from the world's popup menu.
- To open an inspector to view the properties of an individual JavaScript
object, choose the Inspect menu item from an object's popup menu.
- The inspector displays data in tree format. Individual branches of the tree
can be expanded and collapsed to view substructures in more or less detail.
- NOTE: Many of the objects displayed in the tree cannot be expanded
because the details are not available from the underlying JavaScript engine.
- Also, because of
a bug in the current implementation, the properties of the object are
not expandable when the inspector is opened for viewing individual objects
(option 2 summarized above).
- The inspector has a number of different controls and viewing modes:
- The Refresh button updates the tree.
- Choose the Enable Sorting option to display the variables and/or
methods in a sorted order. Both ascending and descending sort orders
are available.
- Uncheck the Clip Long Lines option to display the full details
of each object. When viewing methods/functions, this will ensure that
full source code is displayed; however, individual lines in the tree
may become very large.
- Use the Show All / Show Variables Only / Show Functions Only
selection box in the upper right corner to choose how much information
will be displayed. By default, only the variables of each object will
be shown.
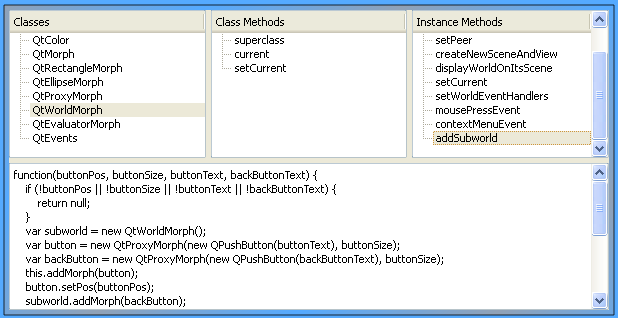
Class Browser
- Lively for Qt includes a class browser that can be used for viewing
classes and their instance and class methods.
- The class browser contains four panes:
- Top left pane displays the JavaScript classes of the Lively for Qt system.
- Top central pane displays the class methods of the currently selected class.
- Top right pane displays the instance methods of the currently selected class.
- Bottom pane displays the source code of the currently selected class or instance method.
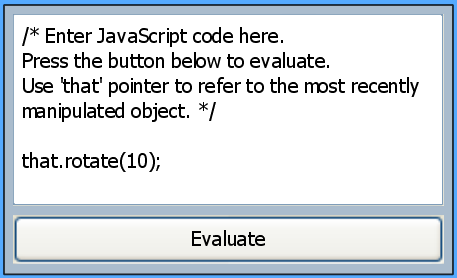
Source Code Evaluator
- Source code evaluator is a tool that can be used for executing
JavaScript code while the Lively for Qt system is running.
- Enter executable source code in the text editor
and press Evaluate to execute the code.
- The normal cut/copy/paste and other text editing capabilities
are available when editing the JavaScript code.
- In the JavaScript code, you can use the that pointer to refer to the
user interface object that has been touched with the mouse most recently.
- The that pointer is especially convenient when picking references
to objects that have been created interactively from the user interface.
- The that pointer can be used for many other purposes as well,
e.g., to easily apply the same script to different
objects on the screen.
- Note: Code entered in the evaluator is executed in a
try-catch
block inside the evaluator, so no debugger window is opened if an error occurs.
Instead, error messages are displayed within the evaluator window itself.
- To manually open a debugger from the evaluator, type "
debugger;"
in the evaluator window and then press Evaluate.